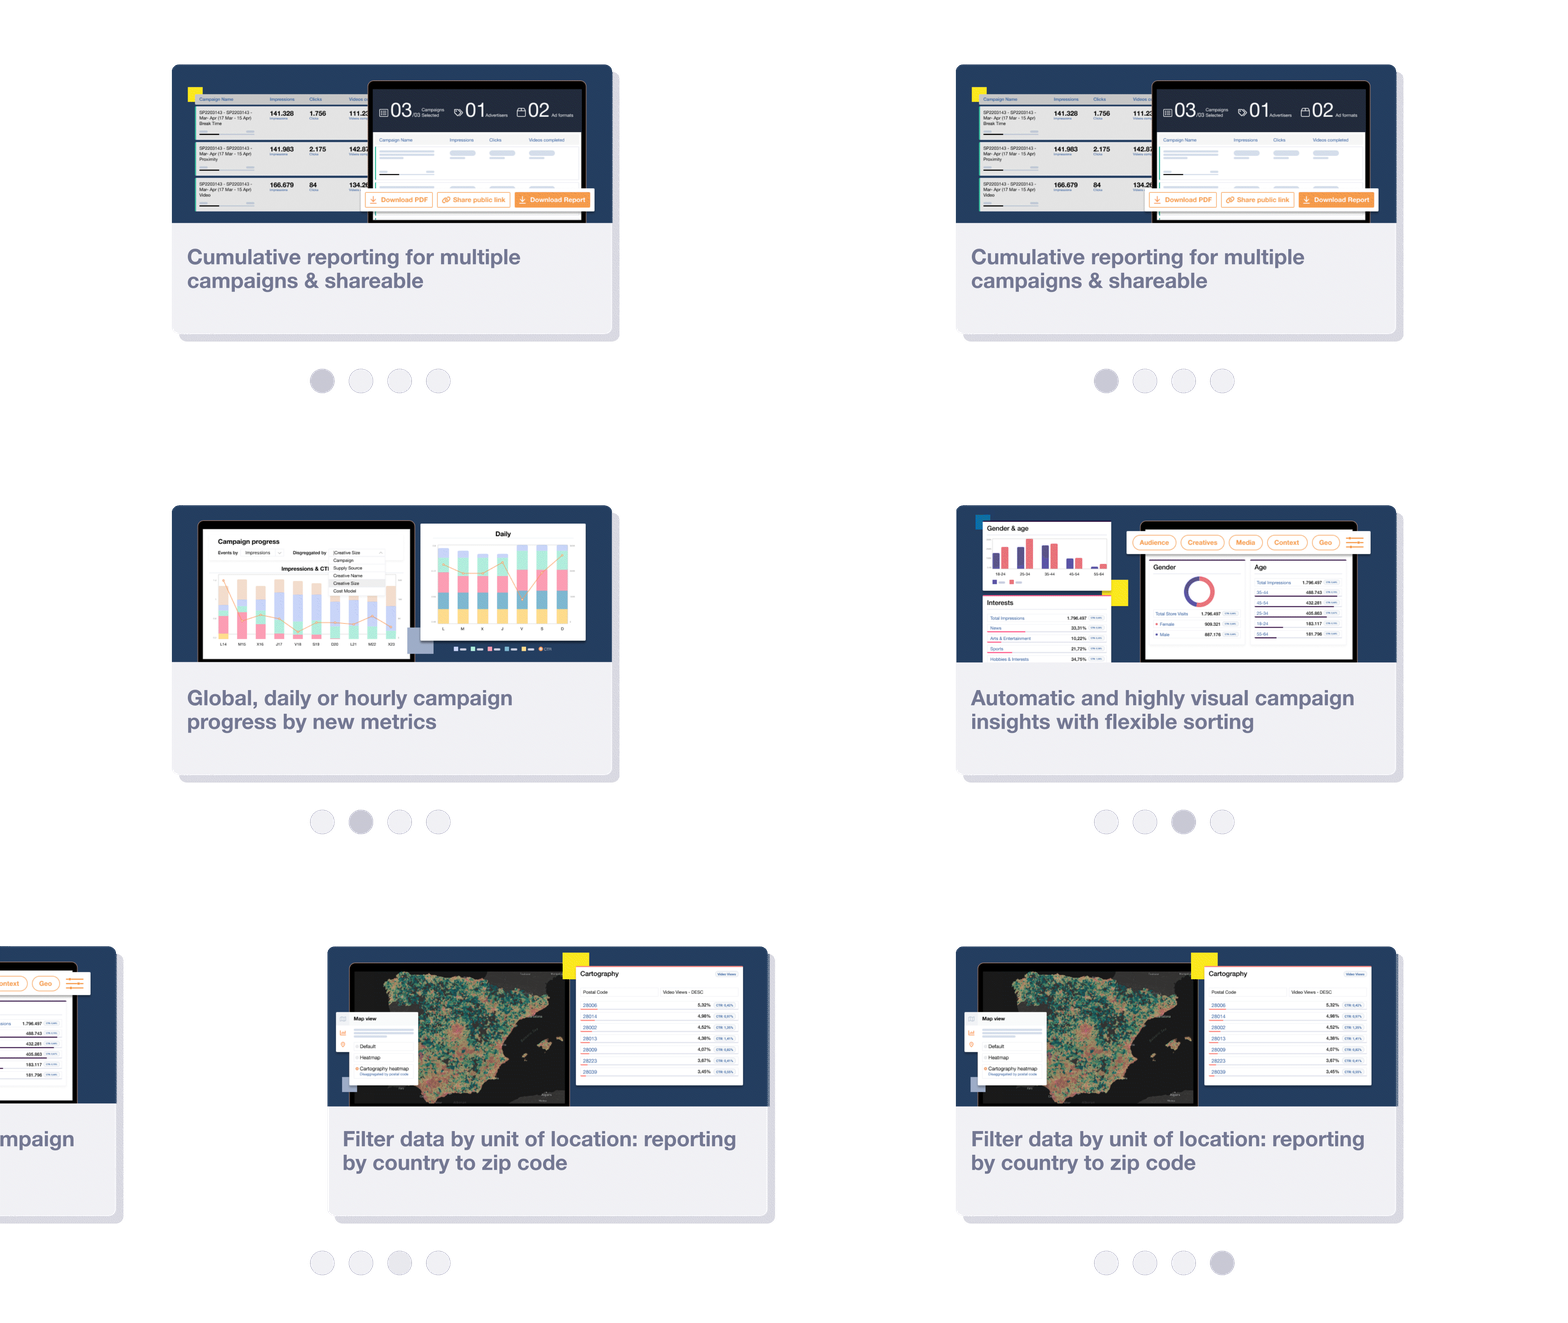
The new reporting contains features that make campaign analysis and optimization both faster and more thorough. Just a few of them include:
- Cumulative reporting for multiple campaign line items & advanced options to easily share
- Global, daily or hourly campaign progress by new metrics
- Automatic and highly visual campaign insights with flexible sorting
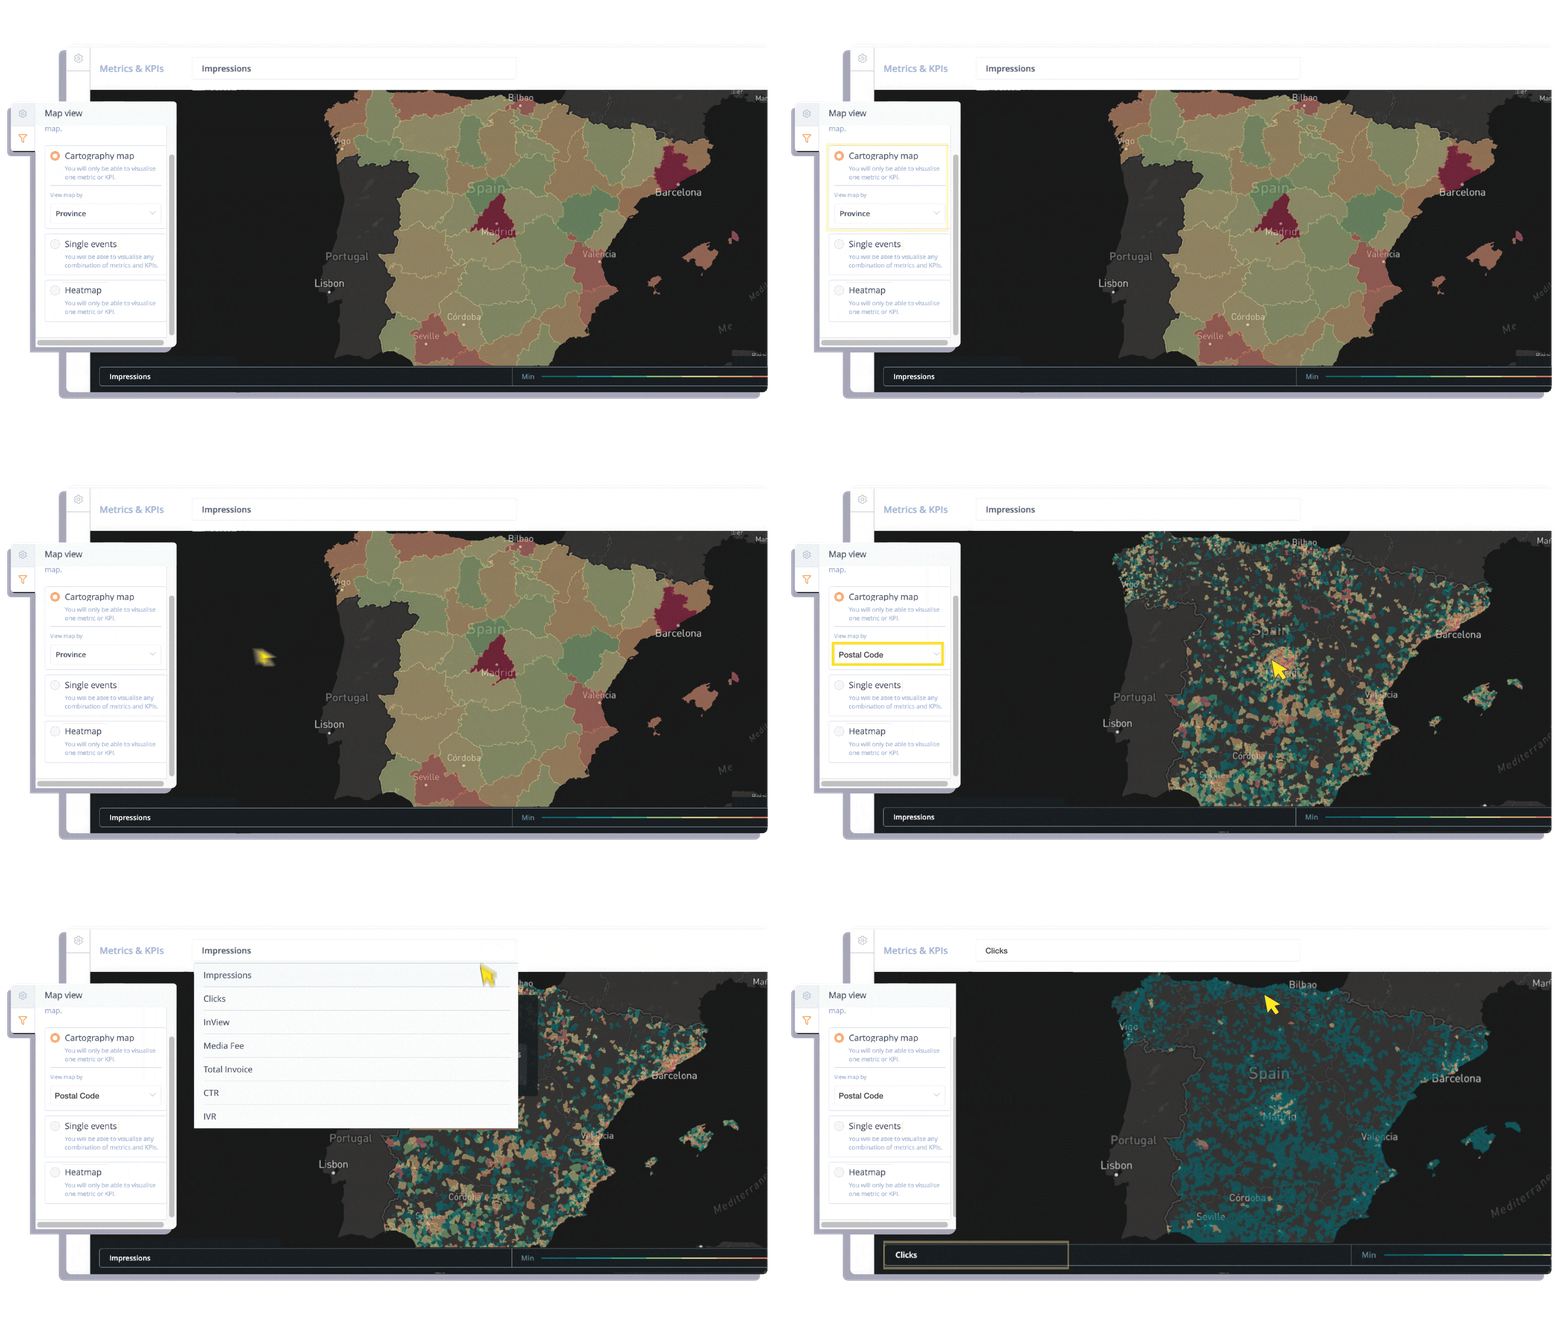
- Cartographic reporting to see data by location (from country all the way to performance by zip code)
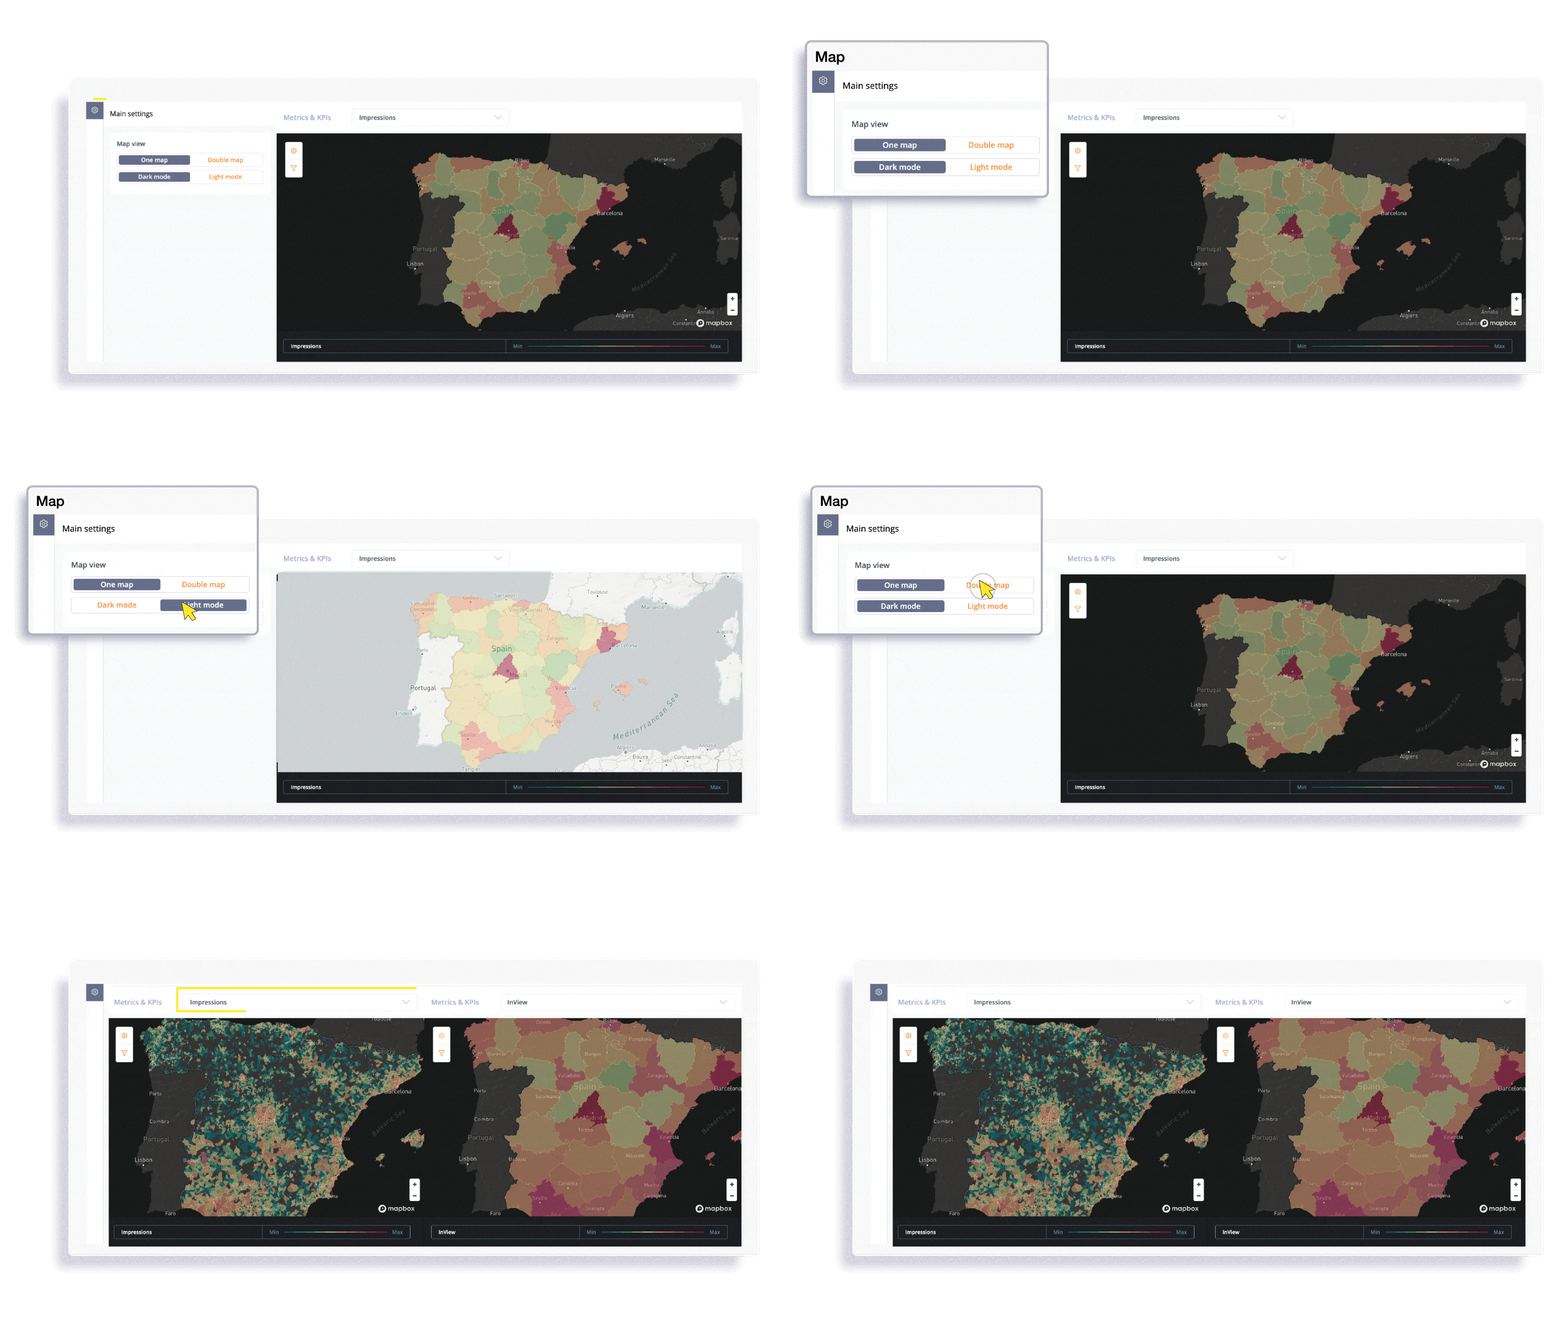
- Visualization of key metrics on new maps
Below, we show you what each feature looks like and highlight the key perks.
Multiple campaign reporting & easily shareable
Feature Highlights
- Cumulative reporting for multiple campaigns, with the option to disaggregate as needed
- Share a customizable PDF of the reporting
- Share a live link to the dashboard
Automatic Graphs: Global, daily or hourly campaign progress by new metrics
Feature Highlights
- Automatic bar graphs compare two primary values: a campaign metric and a KPI for more accurate analysis
- Further break down the data by seeing values like impressions, clicks or visits per creative size, supply source, audience demographics and more
- Data can be shown globally or by day and hour
- Detailed graphs for other key metrics also available
Automatic and highly visual campaign insights with flexible sorting
Feature Highlights
When applicable, see top 5, top 10 or top 50 values with flexible sorting
Cartographic Reporting & New Maps
Feature Highlights


